DASHBOARD
This document will walk you through what you can do with the dashboard and how valuable it can be for all team members to have a sense of what is going on with the business at a glance.
Skip ahead to
- Preview your site
- Orders and Inquiries
- Sales Graph & Order/Inquiry/Review Summary by site
- News & Updates
- Menus
Preview your site
From the Dashboard the easiest way to navigate to the front end of your site is by clicking Preview:Site link in the upper left hand corner above the Web Shop Manager logo. By clicking this link, the front end of your site will open in a new tab.

Orders & Inquiries
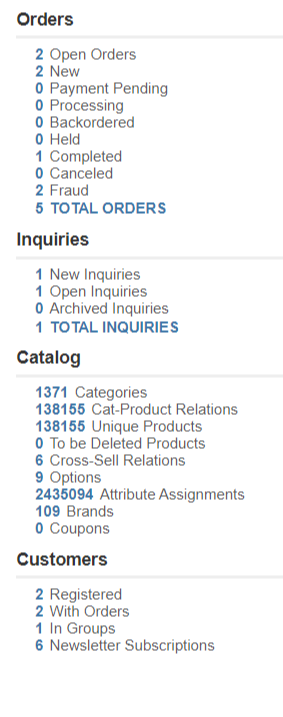
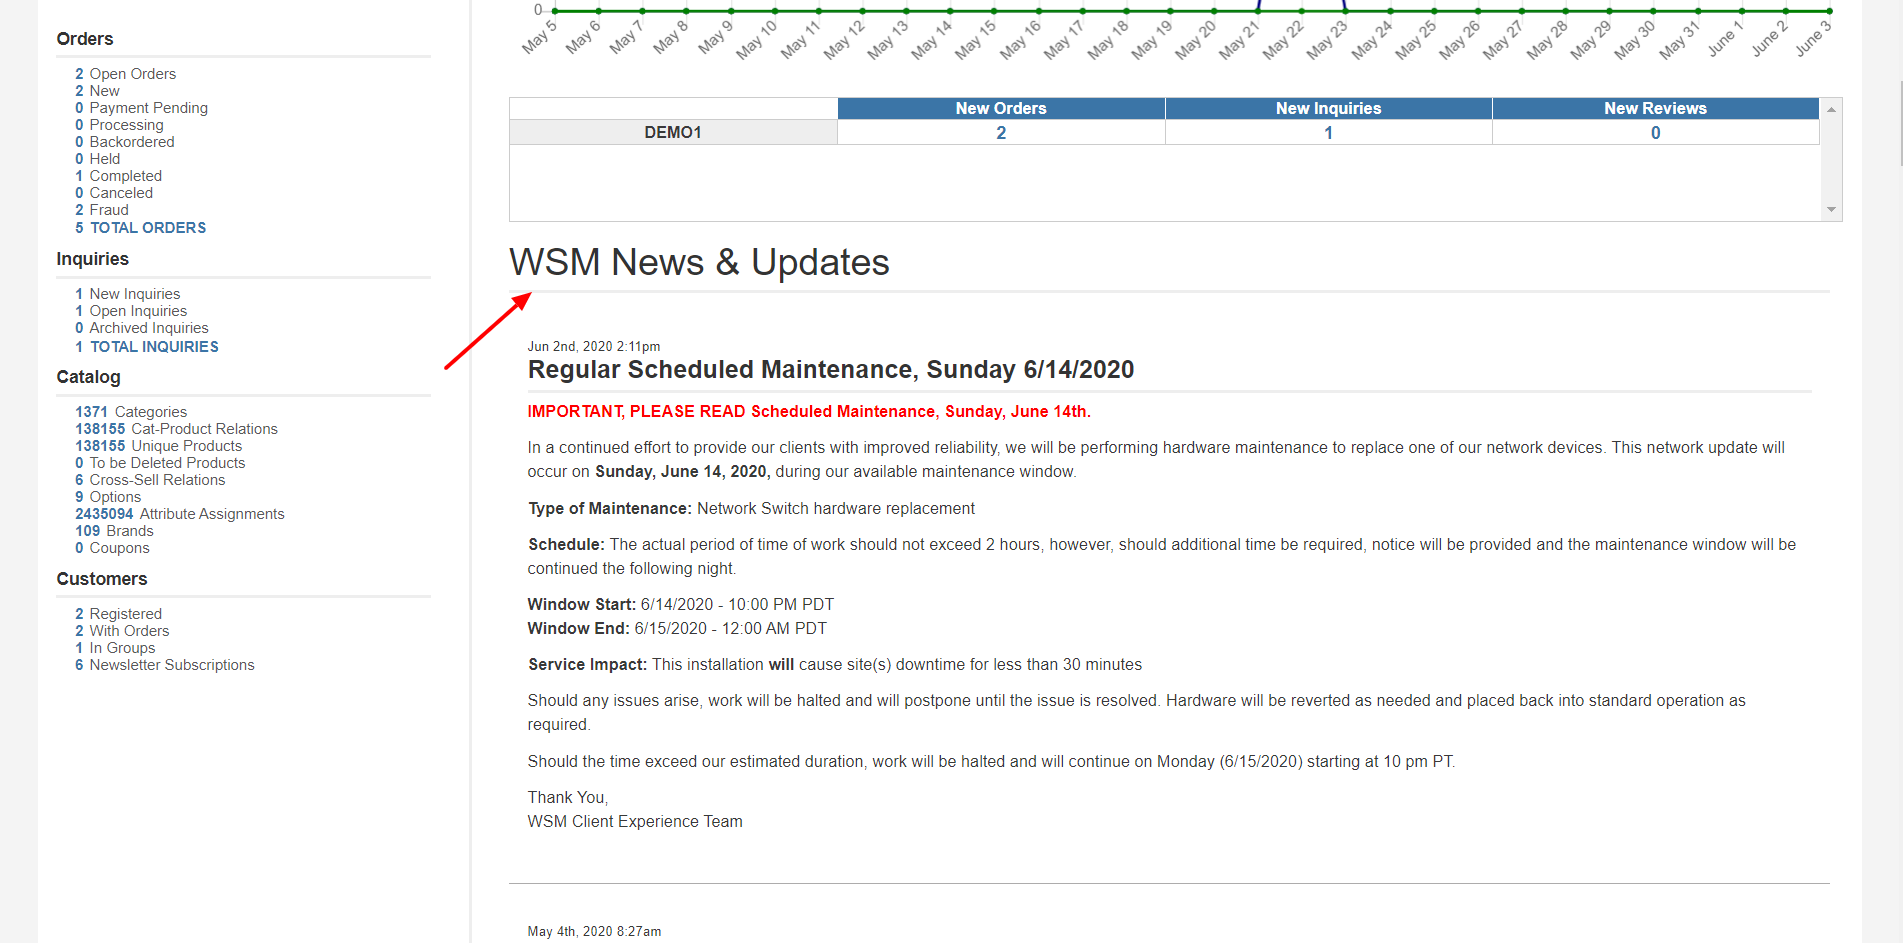
On the Dashboard you will find some statistics including your total revenue for the year, along with an Order, Inquiry, Catalog, and Customer breakdown along the left hand side. You can click on each item within those lists for quick links to those areas of the back end of your site. For instance, clicking New under orders is a very quick way to sort orders that have yet to be processed.

Sales Graph & Orders/Inquiries/Review summary by Site
The sales graph located in the center of your Dashboard will give you a visual representation of your sales and inquiries per day for the month. You can also click the tabs at the top of the graph for sales information displayed in different ways.
Below the sales graph is a list of each site associated with your account (if applicable) and a breakdown of New Orders, New Inquiries, New Reviews for all. Each number is hyperlinked as a quick link to that information on the other sites.
When Order status is used properly the graph will accurately display sales totals for the period selected.
News & Updates
Located directly below the Sales Graph is a section dedicated to News & Updates. Here you will find any new tools, functionality, known issues updates, or enhancements to WSM. This will be updated periodically, so be sure to check in regularly for new ways to build upon your web presence.

Menus
Across the top of the page in green you will find the Menus for navigating WSM. Each category has a drop down menu of options beneath it for quick access to tools and options. At the far left you will find the Dashboard button to quickly bring you back to the opening page.